


Videohive - Vox Style Data Report Infographic - 65610075
After Effects Version CC | Resizable | Music included 🎸 | 69.6 MB
After Effects Version CC | Resizable | Music included 🎸 | 69.6 MB
https://videohive.net/item/vox-style-data-report-infographic/65610075
Features:
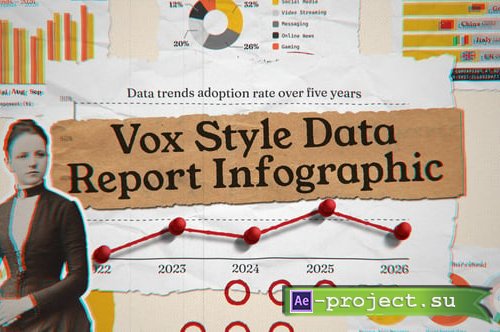
Editorial Torn-Paper Aesthetic: Signature ripped kraft-paper banner overlays and layered collage-style backgrounds evoke the tactile, analog charm of investigative print journalism — juxtaposed against crisp digital data visualizations for a striking, award-worthy contrast.
Animated Line Charts with Data Points: Smooth, story-driven line graph animations trace multi-year data trends (2022–2026) with bold red data-point nodes that snap into position frame by frame — making trend storytelling feel dynamic and purposeful.
Donut & Pie Chart Sequences: Animated segmented charts break down category distributions — including Social Media, Video Streaming, Messaging, Online News, and Gaming — with clean percentage reveals and color-coded legend callouts.
Country Comparison Bar Charts: Horizontal bar chart animations with national flag icons display regional breakdowns for countries including Germany, China, Italy, and the UK — ideal for global research reports and international market analyses.
Monthly Digital Trends Bar Graph: A vertically stacked multi-bar graph spanning monthly intervals (May through September) animates with staggered entrance effects — perfect for presenting longitudinal engagement and adoption data.
Vintage Photographic Cutout Elements: Retro black-and-white portrait cutouts with chromatic aberration RGB-split effects add a bold, magazine-editorial personality that sets this template apart from generic corporate data presentations.
Progress Ring Indicators: Animated circular donut rings display audience outlook statistics with bold percentage callouts — communicating forward-looking survey data like AI adoption expectations and data preference insights.
Bold Display Typography: Large-scale, high-contrast serif and display fonts deliver headlines with commanding editorial weight — easily swapped to reflect your publication’s voice and brand identity.
Rich Amber, Crimson & Charcoal Palette: A warm, journalistic color system rooted in deep golds, burnt oranges, reds, and near-blacks creates a cohesive visual identity across every chart type and infographic module.
Fully Customizable: Update all data values, chart labels, country names, percentage figures, category titles, and color accents to match any dataset or brand guideline with ease.
Modular Scene Architecture: Every infographic section is independently structured, allowing you to assemble, reorder, or extend sequences to fit short social reports, long-form documentary segments, or broadcast news packages.
Full HD & 4K Ready: 1920×1080 and 3840×2160 compositions at 29.97 fps.
No Plugins Required
Well-Organized Project Structure
Video Tutorial Included
Free Fonts Included
Images not included in download.
Скачать | Download:
